|
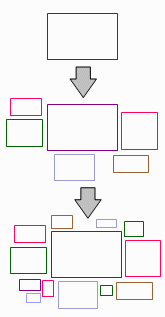
- leaf-nodes as colored icons, and
- non-leaf-nodes as rectangular borders.
|
There are many hierarchical data in our daily life, such as file systems,
human organizations of companies, and category-based search Web site.
Visualization of hierachcal data is useful for understanding, monitoring,
exploring, and analyzing such various data.
We developed a hierarchical data visualization technique which represents
whole the data in one display space. As shown in left figure, our
technique represents tree structure by the following way:
|
Key points of our technique is display layout of the icons and rectangular
borders. We developed fast rectangle packing techniques for the display
layout of the icons and recutangular borders.
The techniques assume that rectangles are placed onto display spaces
one-by-one, satisfying the following conditions:
|

|

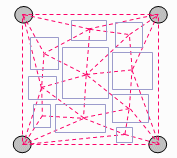
| First our visualization technique, "data jewelry box" uses a triangular mesh connecting centers of previously placed rectangles, to quickly find positions to place remaining rectangles satisfying the above conditions. |
| Second our visualization technique, "heiankyo view" uses a grid structure represents the occupancy of recutangular display spaces, to quickly find positions to place remaining rectangles satisfying the above conditions. |

|
Biggest problem of the above techniques is that they may occur much different
display layout results though input hierarchical data is very similar.
To solve the problem we improved the techniques so that they can refer
"template" that describes ideal positions of icons and recutangular borders,
as shown in below figure.
In the improved techniques we applied one more condition in addition to
above mentioned two conditions, as follows:
|

|
| We applied the hierarchical data visualization technique to the analysis of Web access logs. We formed hierarchical data according to directory hierarchy of Web pages, and then mapped the statictics of accesses onto the hierarchical data. Below image is an example of visualization result. We found some interesting access trends from the results. |
 |
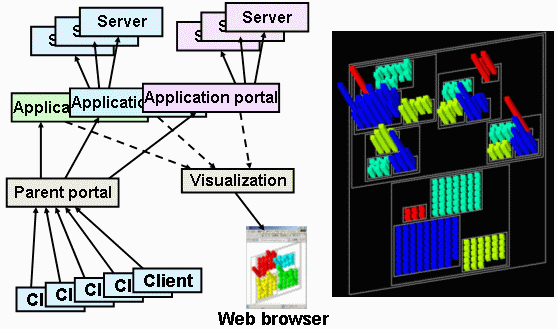
| We also applied the hierarchical data visualization technique to the monitoring of jobs in a distributed computing environment. We formed hierachical data according to status of jobs, and represented it as SVG images so that users can be remotely monitor the status of jobs via Web browsers. |
 |
|
In addition to the above two applications, we are trying to apply the visualization techniques to the following applications:
|
Related publications:
Yamaguchi Y., et al., Interactive Poster: Web Site Visualization Using a Hierarchical Rectangle Packing Technique, IEEE Information Visualization Symposium, 2002.
Yamaguchi Y., et al., Visualization of Distributed Processes Using "Data Jewelry Box" Algorithm, CG International 2003, pp. 162-169, 2003.
Itoh T., et al., HeiankyoView: Orthogonal Representation of Large-scale Hierarchical Data, International Symposium on Towards Peta-Bit Ultra Networks (PBit 2003), pp. 125-130, 2003.
Itoh T., et al.,
Hierarchical Data Visualization Using a Fast Rectangle-Packing Algorithm,
IEEE Transactions on Visualization and Computer Graphics, accepted.