Our Laboratory explore about "visualization", which has been contributed to various issues on science and technology.
This page introduces our researches on visualization that is closely relevant to science and technology.
|
Recent studies have shown that not only proteins but also many other chemical reactions are closely linked with the molecular surfaces.
The further analysis of this relationship could contribute to the development of new drugs and
the investigation of source of diseases.
The figure above shows the results of the chemical analysis of proteins by extracting convexo and
concave part of molecular surface and grouping by the resemblance of them. For that purpose,
we propose PROTEIN (Partial Relief Observation TEchnique and INterface), a technology to extract
resembled characteristics that helps to analyze the surface figure of protein.
To study the relationships between the surface figure and chemical phenomena of protein would contribute to solve many problems.
The figure below shows the large concave parts of a protain surface figure which are likely to react with drugs,
extracted by the system and displayed in blue.
Spherical assemblies around the protain surface are non-protein molecules
which are seen in the locations where they can easily react with protains.
The fact that these parts where spheres concentrate are displayed in blue indicates the Pocket extraction is beneficial
in protain reaction analysis.
|
|
-
K. Nishiyama, T. Itoh,
PROTEIN: A Visual Interface for Classification of Partial Reliefs of Protein Molecular Surfaces,
The Institute of Image Electronics Engineering of Japan, Vol. 37, No. 3, pp. 181-188, 2008.
(PDF)
- K. Nishiyama, T. Itoh,
PROTEIN: A Visual Interface for Classification of Partial Reliefs of Protein Molecular Surfaces,
IIEEJ Image Electronics and Visual Computing Workshop, 2007.
(PDF)
- Y. Nakamura, T. Itoh, Fast Detection and Visualization of Protein
Surface Pockets for Drug Design, The 11th Asian Symposium on
Visualization, 2011.
|
|
In the field of pharmaceutical development, it is important to predict the results of experiments
in developing new drugs in order to reduce time.
This figure is a sample of visualizing large amounts of drug information that pharmaceutical companies produce through
the "Twelve-layered View" method. Many different kinds of drugs are grouped according to their molecular structures and
shown in different colors based on the experimental results.
The figure above can lead to the prediction that "if the drugs in the same group are shown in the same color,
the development of the new drug may result in similarly". This research product is already used in the field development.
|
-
M. Yamazawa, T. Itoh, F. Yamashita,
Visualization and Level-of-Detail Control for Multi-Dimensional Bioactive Chemical Data,
12th International Conference on Information Visualization (IV08),
pp. 11-16, 2008.
(PDF)
- F. Yamashita, H. Hara, T. Itoh, M. Hashida,
Novel Hierarchical Classification and Visualization Method for Multiobjective Optimization of Drug Properties: Application to Structure-Activity Relationship Analysis of Cytochrome P450 Metabolism,
Journal of Chemical Information and Modeling, Vol. 48, No. 2, pp. 364-349, 2008.
- F. Yamashita, T. Itoh, H. Hara, M. Hashida,
Visualization of Large-Scale Aqueous Solubility Data Using a Novel Hierarchical Data Visualization Technique, Journal of Chemical Information and Modeling,
Vol. 46, No. 3, pp. 1054-1059, 2006.
|
|
There are countless thousands of genes in one living organism.
To figure out the functions of an individual gene would contribute to
develop new drugs, investigate source of diseases, and clarificate the evolutional process.
The figure above shows the consequence of visualization by categorizing tens of thousands of genes
by function analysis, networking the genes which are related but belong in a different category.
The figure below also shows the visualization result.
The thousands of genes are shown in different colors by the features led by the experimental result for the function analysys,
and they are networked by the lines which represent the relation called "interaction".
As the result, the visualization technology is expected to contribute also in the field of genetic analysis.
|
|
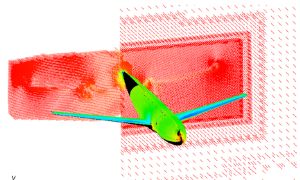
In the design process of cars and aircrafts, performance and safety analyses based on fluid dynamics are very important.
Especially "Experimental Fluid Dynamics(EFD)" and "Computational Fluid Dynamics(CFD)" are considered to be the two major technologies.
As each of these methods has its own merits and demerits, the fusion analysis technique has being developed recently.
This figure shows a visualization result to compare the atmospheric pressure around an airplane and the result of EFD and CFD.
we would like to help technological expansion based on fluid dynamics by advancing development of the fusion analysis technique of EFD and CFD.
This is a collaborative research with JAXA.
|
|
- S. Kasamatsu, T. Itoh, S. Watanabe, S. Kuchi-ishi, K. Yasue, A Study
on Visualization for EFD/CFD Integration, IEEE Pacific Visualization
2011, Poster Session, 2011.
|
|
There are numbers of computational simulations that aim to clarify the natural phenomenon and to design industrial products.
These include many simulations of the streamline of air and water, and the related technologies have long been studied.
This three-dimensional diagram is an example of a simulation to find out the meteorological phenomena,
which shows the distribution of high and low pressure and wind currents.
Three-dimensional visualization technique can contribute to study not only of climatic phenomena
but of other natural phenomena.
|
-
S. Furuya, T. Itoh,
A Streamline Selection Technique for Integrated Scalar and Vector Visualization,
IEEE Visualization, Poster Session, 2008.
(PDF)
- M. Hirano, T. Itoh, S. Shirayama,
Numerical Visualization by Rapid Isosurface Extractions Using 3D Span Spaces,
Journal of Visualization, Vol. 11, 2008.
|
|
There are hundreds or thousands of indicators such as thermometers, barometers, and accelerometers in an atomic power plant,
operated under the strict safety control.
Visualization technique is effective to view the readout by these indicators so that abnormal values are discovered instantly.
The figure is an example of visualising the data in an atomic power plant.
A vertically long window on the left shows a time rate using a visualization technique named "KONJYAKU MONOGATARI".
It helps us to know the time when a trouble occurred in measured data.
The right window shows the readout by several hundred.
This visualization technology can promptly detect the unusual measurement.
This work is part of an achievement by Ochanomizu University titled "Research and development of visualizing
massive information of atomic management system," a contracted project with the Ministry of
Education based on the Law on Special Accounts for Electric Power Development Acceleration Measures.
|
|
-
T. Itoh, S. Furuya, H. Ohshima, K. Okamoto,
Hierarchical Data Visualization for Atomic Plant Data,
Journal of Fluid Science and Technology, Vol. 3, No. 4, 2008.
(PDF)
|
|
Many issues that we have introduced as above include time variations.
Scientific mechanism is searched through the time course of physical quantity like temperature and atmospheric pressure,
for example, in the measurement data of atomic plants, experimental results of genes, and results of meteorological simulations.
Therefore, it is worth understanding the time variations in terms of visualization.
The diagram is a representation of a large scale data of time series, each selected and displayed by line graphs using
the technique called FRUITS Time.
This selective visualization of representative data enables users easy to discover the specific phenomenon among data.
|
-
Y. Uchida, T. Itoh,
A Visualization and Level-of-Detail Control Technique for Large Scale Time Series Data,
IEEE Information Visualization, Poster Session, 2008.
(PDF)
-
M. Imoto, T. Itoh,
A 3D Visualization Technique for Large Scale Time-Varying Data,
14th International Conference on Information Visualisation (IV10), 2010.
(PDF)
|
|
Many simulations in science and technology require great amount of trials and errors to reach the answer.
Conversely, for the successful simulation in science and technology,
the essential process is to find the most relevant parameters in the experiments.
The technique called "optimization problem" is frequently used in this process.
One of the most well-known techniques is the genetic algorithm, which was applied effectively for
the body shape of NOZOMI SHINKANSEN.
The figure shows the result of visualizing a calculation process of
EMACI (Evolutional Multi-parameter Analysis and Control Interface) to make the genetic algorithm success.
We proved that this visualization results in a high probability of success, with changing the settings of
the genetic algorithm dyamically.
The cardiac muscle cell simulation is used as a material in this experiment.
|
|
- K. Ohyama, T. Itoh, F. Yamashita, K. Koyamada,
EMACI: A Visual Interface of Multi-Parameters for Interactive Evolutionary Algorithm,
IIEEJ Image Electronics and Visual Computing Workshop, 2007.
(PDF)
|