
April 10-13, 2018 - Kobe, Japan
The 11th IEEE Pacific Visualization Symposium (PacificVis 2018) will be held in Kobe, Japan during April 10 to 13, 2018. Visualization has become an increasingly important research area due to its wide range of applications in many disciplines. PacificVis is an IEEE sponsored international visualization symposium held in the Asia-Pacific region, with the objective to foster greater exchange between visualization researchers and practitioners, and to draw more researchers in the Asia-Pacific region to enter this rapidly growing area of research.
PacificVis is a unified visualization symposium, welcoming all areas of visualization research such as: information visualization, scientific visualization, graph and network visualization, visual analytics, and specific applications such as (but not limited to) security-, software- and bio-visualization. Authors are invited to submit original and unpublished research and application papers in all areas of visualization. We encourage papers in any new, novel, and exciting research area that pertains to visualization.
2018.1.20 – The due date of Visual Data Storytelling Contents has been extended.
2017.12.29 – Registration site is open.
2017.12.29 – Updates with PacificVAST important dates
2017.12.29 – Submission sites for Posters and Visual Storytelling Contest are open.
201710.31 – Submission site for Visualization Notes is open.
2017.9.7 – CFP for visualization notes is out.
2017.9.5 – CFP for posters is out.
2017.8.25 – PacificVis 2018 is officially approved to be IEEE PacificVis. Official formatting guideline is ready.
2017.8.25 – PasificVAST dates are fixed and a link to author guidelines are provided.
2017.08.16 – CFP for full papers is out.
2017.08.15 – Submission site for Full Papers is open.
2017.08.11 – Venue and Travel information is added.
2017.07.27 – We are open.


![]()
![]()
![]()

![]()


![]()
![]()
| Year | City | Date | Link |
|---|---|---|---|
| 2017 | Seoul | Apr 18 - Apr 21 | Website |
| 2016 | Taipei | Apr 19 - Apr 22 | Website |
| 2015 | Hangzhou | Apr 14 - Apr 17 | Website |
| 2014 | Yokohama | Mar 04 - Mar 07 | Website |
| 2013 | Sydney | Feb 26 - Mar 01 | Website |
| 2012 | Songdo | Feb 28 - Mar 02 | Website |
| 2011 | Hong Kong | Mar 01 - Mar 04 | Website |
| 2010 | Taipei | Mar 02 - Mar 05 | Website |
| 2009 | Beijing | Apr 20 - Apr 23 | Website |
| 2008 | Kyoto | Mar 04 - Mar 07 | Website |
| Abstract due | Sep. 22, 2017 |
| Full paper due | Sep. 29, 2017 |
| Reviews due | Nov. 5, 2017 |
| 1st cycle notification | Nov. 20, 2017 |
| Revision due | Jan. 5, 2018 |
| 2nd cycle notification | Jan. 22, 2018 |
| Camera ready paper due | Feb. 2, 2018 |
All deadlines are due at 9:00 pm Pacific Time (PDT/PST).
| Notes Deadline | Dec. 4, 2017 |
| Notes Notification | Jan. 12, 2018 |
| Camera ready Notes due | Feb. 2, 2018 |
The deadline is due at 9:00 pm Pacific Time (PST).
| Poster papers submission deadline | Jan. 19, 2018 |
| Poster papers notification | Feb. 7, 2018 |
| Camera ready poster papers due | Feb. 21, 2018 |
Deadlines are due at 9:00 pm Pacific Time (PST).
| The submission deadline | Jan. 26, Jan. 19, 2018 |
| The notification | Feb. 14, Feb. 7, 2018 |
| Final submission | Feb. 28, Feb. 21, 2018 |
Deadlines are due at 9:00 pm Pacific Time (PST).
| Deadline for submission | December 11th (Mon), 2017 |
| First round notification | February 2 (Fri), January 19th (Fri), 2018 |
| Deadline for Revision | February 23 (Fri), February 9th (Fri), 2018 |
| Second round notification | March 12 (Mon), February 25th (Mon), 2018 |
| Deadline for camera ready draft | March 28 (Wed), March 12th (Mon), 2018 |
Deadlines are due at 23:59 Pacific Time (PST).
All submitted papers will go through a two-stage review process to guarantee the publication of high-quality papers. All papers accepted by IEEE Pacific Visualization 2018 will be published by IEEE and will be also included in the IEEE Digital Library. Selected papers will be published directly in IEEE Transactions on Visualization and Computer Graphics (TVCG).
| Abstract due | Sep. 22, 2017 |
| Full paper due | Sep. 29, 2017 |
| Reviews due | Nov. 5, 2017 |
| 1st cycle notification | Nov. 20, 2017 |
| Revision due | Jan. 5, 2018 |
| 2nd cycle notification | Jan. 22, 2018 |
| Camera ready paper due | Feb. 2, 2018 |
All deadlines are due at 9:00 pm Pacific Time (PDT/PST).
Suggested topics include, but are not limited to:
Original unpublished papers of up to ten (10) pages (two-column, single-spaced, 9 point font, including figures, tables and references) are invited. Manuscripts must be written in English, and follow the formatting guidelines. Reviewing will be double blind, please remove all author and affiliation information from submissions and supplemental files. Please substitute your paper’s ID number for the author name. Papers should be submitted electronically in Adobe PDF format. Please provide supplemental videos in QuickTime MPEG-4 or DivX version 5, and use TIFF, JPEG, or PNG for supplemental images.
Formatting Guidelines Submission System
Note: This page has previously shown a link to the formatting guidelines for the last year. If you started with your paper using that guidelines, do not worry. There is no update about the guidelines for this year. The link to the fortammting guidelines you see in the previous paragraph points to the same page as one we tentatively provided.
Please use the Author Kit for preparation of the camera ready copy. The page includes templates, an important checklist, and others.
List of program committee members
pvis_papers(at)pvis.org
A VIS paper typically falls into one of five categories: technique, system, design study, evaluation, or model. We briefly discuss these categories below. Although your main paper type has to be specified during the paper submission process, papers can include elements of more than one of these categories. Please see “Process and Pitfalls in Writing Information Visualization Research Papers” by Tamara Munzner for more detailed discussion on how to write a successful VIS paper.
Technique papers introduce novel techniques or algorithms that have not previously appeared in the literature, or that significantly extend known techniques or algorithms, for example by scaling to datasets of much larger size than before or by generalizing a technique to a larger class of uses. The technique or algorithm description provided in the paper should be complete enough that a competent graduate student in visualization could implement the work, and the authors should create a prototype implementation of the methods. Relevant previous work must be referenced, and the advantage of the new methods over it should be clearly demonstrated. There should be a discussion of the tasks and datasets for which this new method is appropriate, and its limitations. Evaluation through informal or formal user studies, or other methods, will often serve to strengthen the paper, but are not mandatory.
System papers present a blend of algorithms, technical requirements, user requirements, and design that solves a major problem. The system that is described is both novel and important, and has been implemented. The rationale for significant design decisions is provided, and the system is compared to documented, best-of-breed systems already in use. The comparison includes specific discussion of how the described system differs from and is, in some significant respects, superior to those systems. For example, the described system may offer substantial advancements in the performance or usability of visualization systems, or novel capabilities. Every effort should be made to eliminate external factors (such as advances in processor performance, memory sizes or operating system features) that would affect this comparison. For further suggestions, please review “How (and How Not) to Write a Good Systems Paper” by Roy Levin and David Redell, and “Empirical Methods in CS and AI” by Toby Walsh.
Application / Design Study papers explore the choices made when applying visualization and visual analytics techniques in an application area, for example relating the visual encodings and interaction techniques to the requirements of the target task. Similarly, Application papers have been the norm when researchers describe the use of visualization techniques to glean insights from problems in engineering and science. Although a significant amount of application domain background information can be useful to provide a framing context in which to discuss the specifics of the target task, the primary focus of the case study must be the visualization content. The results of the Application / Design Study, including insights generated in the application domain, should be clearly conveyed. Describing new techniques and algorithms developed to solve the target problem will strengthen a design study paper, but the requirements for novelty are less stringent than in a Technique paper. Where necessary, the identification of the underlying parametric space and its efficient search must be aptly described. The work will be judged by the design lessons learned or insights gleaned, on which future contributors can build. We invite submissions on any application area.
Evaluation papers explore the usage of visualization and visual analytics by human users, and typically present an empirical study of visualization techniques or systems. Authors are not necessarily expected to implement the systems used in these studies themselves; the research contribution will be judged on the validity and importance of the experimental results as opposed to the novelty of the systems or techniques under study. The conference committee appreciates the difficulty and importance of designing and performing rigorous experiments, including the definition of appropriate hypotheses, tasks, data sets, selection of subjects, measurement, validation and conclusions. The goal of such efforts should be to move from mere description of experiments, toward prediction and explanation. We do suggest that potential authors who have not had formal training in the design of experiments involving human subjects may wish to partner with a colleague from an area such as psychology or human-computer interaction who has experience with designing rigorous experimental protocols and statistical analysis of the resulting data. Other novel forms of evaluation are also encouraged.
Theory/Model papers present new interpretations of the foundational theory of visualization and visual analytics. Implementations are usually not relevant for papers in this category. Papers should focus on basic advancement in our understanding of how visualization techniques complement and exploit properties of human vision and cognition.
The 11th IEEE Pacific Visualization Symposium (PacificVis 2018) will be held in Kobe, Japan during April 10 to 13, 2018. Visualization has become an increasingly important research area due to its wide range of applications in many disciplines. PacificVis is an IEEE sponsored international visualization symposium held in the Asia-Pacific region, with the objective to foster greater exchange between visualization researchers and practitioners, and to draw more researchers in the Asia-Pacific region to enter this rapidly growing area of research.
PacificVis 2018 features a short paper track, called “Visualization Notes.” The purpose of this track is to encourage young researchers to present their work and discuss with participants including senior researchers there. The submissions can be late-breaking results and work in progress, while they should be novel enough to attract interest from the visualization community.
The suggested topics for the “Visualization Notes” are the same as those for full papers, while the ideas there can be relatively small as compared with those for full papers. Nonetheless, the “Visualization Notes” are still expected to contain technically interesting results in theories and/or applications. Please note that all submissions must be original and thus have not been published elsewhere. All submitted papers will be peer-reviewed through a single-stage process by the international program committee. Accepted short papers will be included in the conference proceedings and in IEEE digital library.
| Notes Deadline | Dec. 4, 2017 |
| Notes Notification | Jan. 12, 2018 |
| Camera ready Notes due | Feb. 2, 2018 |
The deadline is due at 9:00 pm Pacific Time (PST).
Original unpublished short paper submissions of up to 4 pages (two-column, single-spaced, 9-point font, including figures and tables) without references or 5 pages including references are invited. Manuscripts must be written in English, and follow the formatting guidelines. Reviewing will be double blind, so please remove all author and affiliation information from submissions and supplemental files. Please substitute your paper’s ID number for the author name. Papers should be submitted electronically in Adobe PDF format. Please provide supplemental videos in QuickTime MPEG-4 or DivX version 5, and use TIFF, JPEG, or PNG for supplemental images.
Please use the Author Kit for preparation of the camera ready copy. The page in cludes templates, an important checklist, and others.
pvis_notes(at)pvis.org
Kazuo Misue (University of Tsukuba, Japan)
Filip Sadlo (Heidelberg University, Germany)
Lei Shi (Chinese Academy of Sciences, China)
The 11th IEEE Pacific Visualization Symposium (PacificVis 2018) will be held in Kobe, Japan during April 10 to 13, 2018. PacificVis 2018 is soliciting high quality poster proposals. The PacificVis 2018 poster program is welcoming all areas of visualization research such as: information, scientific, graph, security, software and bio-visualization. Authors are encouraged to submit work in progress and practical applications to demonstrate novel and applicable ideas in all aspects of visualization.
An interactive poster session will be held to allow plenty of opportunities for one-on-one dialogue and small group discussion in a casual setting. Extended abstracts of the accepted posters will be included in the electronic conference proceedings (USB memory stick distributed to conference attendants).
| Poster papers submission deadline | Jan. 19, 2018 |
| Poster papers notification | Feb. 7, 2018 |
| Camera ready poster papers due | Feb. 21, 2018 |
Deadlines are due at 9:00 pm Pacific Time (PST).
Submissions should be made electronically in Adobe PDF by the deadline. Poster abstract submissions of up to 2 pages (two-column, single-spaced, 9 point font, including figures and tables) are invited. Manuscripts must be written in English, and follow the formatting guidelines. The posters will be peer-reviewed in a one-stage single-blind process. Posters will be evaluated by the PacificVis 2018 Poster Co-Chairs based on the level of contribution, validity of the results, originality, and clarity of presentation. The reviewing will be based primarily on the abstract content but will consider other supplemental materials (videos, images, and so on) if provided.
Accepted poster will be presented at the poster session of the conference. The final posters should be printed with no larger than paper size A0 size (841mm x 1189mm / 33.1″ x 46.8″). At least one author of an accepted poster must register for and attend the conference to present the work. Authors will also be required to present a brief summary of their talk at the fast-forward session.
For questions regarding poster submission, please do not hesitate to contact the chairs directly via pvis_posters(at)pvis.org
Chongke Bi, Tianjin University, China
Masahiko Itoh, The University of Tokyo, Japan
Puripant Ruchikachorn, Chulalongkorn University, Thailand
Following the success of the successful 2017 IEEE PacificVis Data Storytelling Contest, the contest will take place for the second time in 2018. Data storytelling, narrative visualization, or explanatory visualization has emerged as an important industry trend, with events such as the Tapestry Conference, the Information is Beautiful Awards, and the Malofiej Infographics World Summit, as well as new visual essay publications and blogs such as The Pudding, Explorable Explanations and Google News Lab’s Data Journalism blog. The purpose of this contest is to encourage students and researchers to demonstrate the value of their visualization research through effective visual data storytelling, and to contribute to this exciting development in the broader visualization community.
PacificVis is a unified visualization symposium, welcoming all areas of visualization such as: information, scientific, graph, security, and software visualization. Storytellers are invited to submit visual data-driven stories that draw upon any of these areas. Unlike contests such as the VAST challenge or the SciVis Contest, the data for the PacificVis visual data storytelling contest will be left unspecified; storytellers are free to choose any publicly-available dataset(s). Similarly, the task that storytellers are to accomplish is to successfully communicate a message or series of messages (i.e., a narrative, a series of insights) using visualization techniques and supported by the underlying data. The themes of the story can draw from any topic, including current affairs, history, natural disasters, and research findings from the sciences and humanities.
Videos of the 8 finalists from the 2017 contest can be viewed at https://vimeo.com/pviscontest.
For additional inspiration, consult these articles:
Narrative Visualization: Telling Stories with Data (Segel and Heer, IEEE InfoVis 2010)
Storytelling: The Next Step for Visualization (Kosara and Mackinlay, IEEE Computer 2013)
Visualization Rhetoric: Framing Effects in Narrative Visualization (Hullman and Diakopoulos, IEEE InfoVis 2013)
Understanding Data Videos: Looking at Narrative Visualization Through the Cinematography Lens (Amini et al., ACM CHI 2015)
More than Telling a Story: Transforming Data into Visually Shared Stories (Lee et al., IEEE CG&A 2015)
Or watch these videos:
Once Upon a Time: From Data to Stories (John Schwabish @ Socrata Connect 2017)
Animation, Pacing, and Exposition (Tony Chu @ OpenVisConf 2016)
Where’s Larry? Bringing Data to Life Through Story (Cole Nussbaumer Knaflic @ Tapestry Conference 2017)
Entries may be submitted by teams or individuals, and from both industry and academia alike. Conference sponsors can participate non-competitively. Submissions must fulfill the requirements explained below:
Submissions can take several forms:
Website: an author-hosted website is preferred, however authors may opt to submit a .zip archive of a website containing all dependencies and a readme .txt or .md file with instructions on how to view the website locally. Authors submitting a website are also highly encouraged to submit a .zip archive containing screenshots and/or a video capture of the website via PCS as a fallback in the event that the contest chairs and judges are unable to view the website. Authors are encouraged to use interactive and animated elements that advance the story, such as scrollytelling waypoints or stepper navigation controls. Websites that require the viewer to engage in substantial exploratory interaction are discouraged.
Video: .mp4, .avi, or .mov formats are preferred, with a maximum length of 5 minutes. Note that video submissions that appear to be tutorials or demonstrations of a visualization tool will not be considered; the focus of the submission must be a visual narrative about the data, not a visualization tool or technique.
Data Comic: a multi-page .pdf file that tells a story in the style of a comic book.
Infographic: a single-page poster .pdf file that tells a story.
A succinct story title or headline.
A 150-word extended abstract using the IEEE VGTC poster template that briefly describes the data analysis and design process undertaken by the storyteller(s). The abstract should not include the message(s) communicated by the story; the story must stand alone in this regard such that a viewer should not need to read the abstract to understand the story. If submitting the story as a website, authors must include the URL of the story in this abstract.
A list of references that include the publicly-available dataset(s) that informed the story and those that are visually represented within the story, as well as any tools, libraries, previously published techniques, or software applications used during the data analysis and story design process.
The story must feature at least one programmatically-generated visual representation of data; visual representations of data generated by manual illustration (e.g., on paper, using illustration software) are allowed; however, these representations must be used in conjunction with a programmatically-generated visual representations of data. In addition, the programmatically-generated visual representation(s) should be the authors’ own work, using techniques or tools created by the authors. Third party techniques or applications may be used in conjunction with the authors’ own work as long as proper credit is given to their respective creators and it is made clear which aspects of the implementation represent the authors’ own work.
The entries must be original data-driven stories that have not been previously published elsewhere.
For the winning entries we expect the following additional requirements:
The submission deadline is January 19th Janurary 26th, 2018, 9 PM PST.
The title, submission file, abstract, and reference list should be submitted via PCS.
The notification date is February 7th Feburuary 14th, 2018, 9PM PST.
Final Submission: February 21st Feburuary 28th, 2018, 9PM PST.
A jury of visualization and data storytelling experts will carefully judge each submission. Successful entries will effectively communicate a narrative, message(s), or insight(s) using visual representations of data. Each judge assigned to a submission will give the submission a score from 1 to 5, and they will be asked the following questions:
Is this work relevant for the PacificVis Data Storytelling Contest?
Is the story original (i.e, not previously published elsewhere)?
Is the story engaging and interesting?
Is the narrative point or message of the story clearly discernible? Are insights clearly communicated?
Are data sources adequately referenced?
Are data sources publicly available?
Does the story feature at least one programmatically-generated visual representation of data?
Is it clear which aspects of the story represents the author(s)’ own work, using techniques or tools created by the authors?
Is proper credit given to the creators of third party techniques or applications used to generate the story?
Winning entries will receive a certificate.
| Name | Affiliation |
|---|---|
| Hirofumi Abe | Japan Broadcasting Corporation |
| RJ Andrews | Info We Trust |
| Steven Braun | Northeastern University |
| Jen Christiansen | Scientific American |
| Marti Hearst | University of California, Berkeley |
| Kenji Ishimaru | Polygon Pictures Inc. |
| Asanobu Kitamoto | National Institute of Informatics |
| Isabel Meirelles | OCAD University |
| Jonathan Roberts | Bangor University |
For questions regarding the contest, please do not hesitate to contact the chairs directly via contest@pvis.org.
Matthew Brehmer, Microsoft Research, USA
Ingrid Hotz, Linköping University, Sweden
Hidenori Watanave, the University of Tokyo, Japan
PacificVAST 2018 is an international workshop collocated with PacificVis 2018. The workshop is held on April 10th, the first day of the symposium.
In PacificVAST, participants share their state-of-the-art research results and fresh perspectives on visual analytics. Visual analytics is a discipline concerned with science and technology for analytical reasoning supported by interactive visual interfaces. Most papers presented in PacificVAST are distinguished from traditional visualization papers in that they harmoniously integrate interactive visual interfaces with analytical techniques from statistics, data mining, or machine learning fields to help analyze overwhelming amounts of disparate, conflicting, and dynamic information.
All aspects of visual analytics are covered in PacificVAST including, but not limited to the following topics:
For fostering a stronger visual analytics community in the Asia-Pacific region, PacificVAST starts a new publishing model this year: ALL accepted papers will be published in a special issue of the Elsevier Journal of Visual Informatics on the day of the workshop.
| Deadline for submission | December 11th (Mon), 2017 |
| First round notification | February 2 (Fri), January 19th (Fri), 2018 |
| Deadline for Revision | February 23 (Fri), February 9th (Fri), 2018 |
| Second round notification | March 12 (Mon), February 25th (Mon), 2018 |
| Deadline for camera ready draft | March 28 (Wed), March 12th (Mon), 2018 |
Deadlines are due at 23:59 Pacific Time (PST).
pacific_vast (at) pvis.org, a simple e-mail containing the title, the list of author(s), abstract, and the name and e-mail address of corresponding author. Upon receipt of your request, we will send back a link for the submission to the special issue. There is no page limit, but authors are encouraged to submit papers whose length is proportional to their contributions, and the manuscript should be carefully prepared according to the guide for authors
The template for the final camera ready draft is available.
pacific_vast(at)pvis.org
| Name | Affiliation |
|---|---|
| Thomas Ertl | University of Stuttgart |
| Daisuke Matsuoka | Japan Agency for Marine-Earth Science and Technology |
| Bettina Speckmann | TU Eindhoven |
| Jiawan Zhang | Tianjin University |
| Jaegul Choo | Korea University |
| Michael Aupetit | Qatar Computing Research Institute |
| YuShuen Wang | National Chiao Tung University |
| Klaus Mueller | Stony Brook University - State University of New York |
| Barbora Kozlíková | Masaryk University |
| Quang Vinh Nguyen | Western Sydney University |
| Yun Jang | Sejong University |
| Shuichi Onami | RIKEN Quantitative Biology Center |
| Ulrik Brandes | University of Konstanz |
| Lei Shi | Chinese Academy of Sciences |
About Co-Located Events
PacificVis 2018 will be held on the Integrated Research Center of Kobe University, located in an artificial island called “Port Island” at City of Kobe, Hyogo Prefecture, Japan.
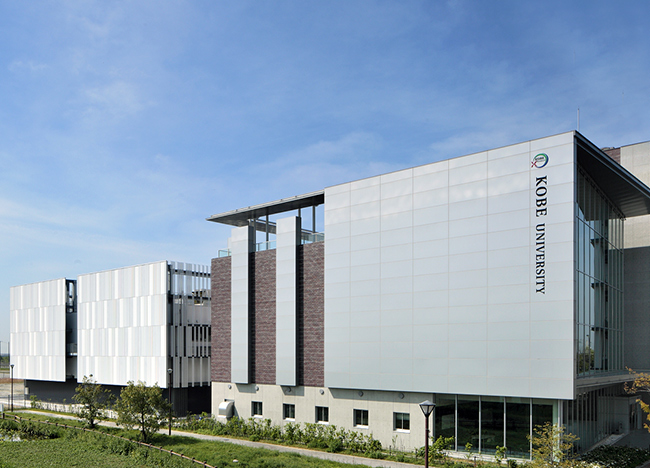
The Integrated Research Center of Kobe University was founded in April 2011 for the purposes of promoting advanced interdisciplinary research, one of the University’s strengths, and exploring the social applications of research. Eight research projects in the newly-built research building (the west side of the main building) were launched in April 2011 and the hall building (the east side of the main building) was added in March 2012. In March 2015, the new annex building was completed with a total floor area of approximately 9,500 m2.
- Address
- 7-1-48 Minatojimaminami-machi, Chuo-ku, Kobe 650-0047 Japan
- Tel.
- +81(0)78-599-6710
- ircpi-hall@office.kobe-u.ac.jp
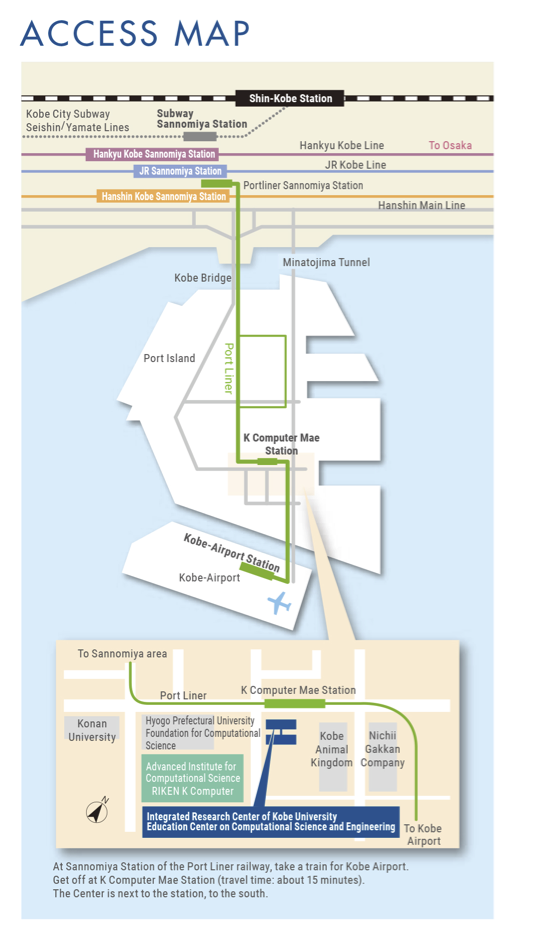
Kobe is an international port city nestled below the beautiful Rokko mountain range and fronted by a tranquil blue inland sea, within the Seto Naikai National Park. People from 131 countries live here and provide Kobe with a colorful, vibrant and cosmopolitan character. As well as its sea port access, downtown Kobe is easily reached by air, road and rail. Kobe has its own domestic airport and the Kansai International Airport nearby. This is why Kobe has hosted more than 4,600 international conventions to date, and why it is one of Japanʼ s key convention cities. In 2013, the Japanese Government appointed Kobe as a ʻGlobal MICE Strategic Cityʼ on behalf of the nation.
More Info:
We had block booking of 40 rooms at Ariston Hotel Kobe. This accomodation service has closed on March 16. Thanks for booking.
Takayuki Itoh
Ochanomizu University, Japan

Stefan Bruckner
University of Bergen, Norway

Koji Koyamada
Kyoto University, Japan

Bongshin Lee
Microsoft Research, USA

Issei Fujishiro
Keio University, Japan

Jinwook Seo
Seoul National University, South Korea
Kazuo Misue
University of Tsukuba, Japan

Filip Sadlo
Heidelberg University, Germany

Lei Shi
Chinese Academy of Sciences, China
Chongke Bi
Tianjin University, China
Masahiko Itoh
The University of Tokyo, Japan

Puripant Ruchikachorn
Chulalongkorn University, Thailand

Matthew Brehmer
Microsoft Research, USA

Ingrid Hotz
Linköping University, Sweden
Hidenori Watanave
the University of Tokyo, Japan

Wei Chen
Zhejiang University, China

Issei Fujishiro
Keio University, Japan

Seokhee Hong
University of Sydney, Australia
Koji Koyamada
Kyoto University, Japan

Kwan-Liu Ma
University of California, Davis, USA
Jinwook Seo
Seoul National University, South Korea

Naohisa Sakamoto
Kobe University, Japan
![]()
Yuriko Takeshima
Tokyo University of Technology, Japan
Shigeo Takahashi
University of Aizu, Japan
Yosuke Onoue
Kyoto University, Japan
Jorji Nonaka
RIKEN AICS, Japan

Hiroaki Natsukawa
Kyoto University, Japan
Hsiang-Yun Wu
TU Wien, Austria
Ken Wakita
Tokyo Institute of Technology, Japan
Akiko Sato
The University of Tokyo, Japan
| Name | Affiliation |
|---|---|
| Daniel Archambault | Swansea University, UK |
| Fabian Beck | University of Stuttgart, Germany |
| Rita Borgo | King’s College London, UK |
| Matthew Brehmer | Microsoft Research, USA |
| Min Chen | University of Oxford, UK |
| Wei Chen | Zhejiang University, China |
| Jaegul Choo | Korea University, South Korea |
| Jia-Kai Chou | University of California, Davis |
| Christopher Collins | University of Ontario Institute of Technology, Canada |
| Christian Duncan | Quinnipiac University, USA |
| Jason Dykes | City University London, UK |
| Issei Fujishiro | Keio University, Japan |
| Helwig Hauser | University of Bergen, Norway |
| Yifan Hu | Yahoo Labs, USA |
| Christophe Hurter | ENAC- French Civil Aviation University, France |
| Petra Isenberg | INRIA, France |
| Yun Jang | Sejong University, South Korea |
| Liang Jie | Peking University, China |
| Karsten Klein | University of Konstanz, Germany |
| Stephen Kobourov | University of Arizona, USA |
| Bum Chul Kwon | IBM Research, USA |
| Alexander Lex | University of Utah, USA |
| Giuseppe Liotta | Universita degli Studi di Perugia, Italy |
| Aidong Lu | University of North Carolina at Charlotte, USA |
| Torsten Möller | University of Vienna, Austria |
| Luana Micallef | Helsinki Institute for Information Technology HIIT, Finland |
| Cao Nan | IBM Research, USA |
| Alex Pang | University of California at Santa Cruz, USA |
| Maurizio Patrignani | Universita’ di Roma Tre, Italy |
| Benjamin Renoust | National Institute of Informatics, Japan |
| Gerik Scheuermann | University of Leipzig, Germany |
| Tobias Schreck | Graz University of Technology, Austria |
| Thomas Schultz | University of Bonn, Germany |
| Michael Sedlmair | University of Vienna, Austria |
| Conglei Shi | IBM Research, USA |
| Lei Shi | Institute of Software, Chinese Academy of Sciences, China |
| Guodao Sun | Zhejiang University of Technology, China |
| Shigeo Takahashi | University of Aizu, Japan |
| Yunhai Wang | Shenzhen Institutes of Advanced Technology, China |
| Yu-Shuen Wang | National Chiao-Tung University, Taiwan |
| Daniel Weiskopf | University of Stuttgart, Germany |
| Thomas Wischgoll | Wright State University, USA |
| Yingcai Wu | Zhejiang University, China |
| Panpan Xu | Bosch Research, USA |
| Lingyun Yu | University of Groningen, Netherlands |
| Xiaoru Yuan | Peking University, China |
| Jian Zhao | FXPAL, USA |
| Name | Affiliation |
|---|---|
| Matthew Brehmer | Microsoft Research |
| Junghoon Chae | Purdue University |
| Guoning Chen | University of Houston |
| Siming Chen | Peking University |
| Hanqi Guo | Argonne National Laboratory |
| Masahiko Ito | University of Tokyo |
| Won-Ki Jeong | Ulsan National Institute of Science and Technology |
| Sungahn Ko | Ulsan National Institute of Science and Technology |
| Stephen Kobourov | University of Arizona |
| Koji Koyamada | Kyoto University |
| Michael Krone | University of Stuttgart |
| Bum Kwon | University of Konstanz |
| Teng-Yok Lee | Mitsubishi Electric Research Laboratories |
| Chun-Cheng Lin | National Chiao Tung University |
| Ross Maciejewski | Arizona State University |
| Shin-ichiro Mori | University of Fukui |
| Chris Muelder | University of California, Davis |
| Quang Nguyen | Western Sydney University |
| Yosuke Onoue | Kyoto University |
| Falk Schreiber | Monash University |
| Guihua Shan | Chinese Academy of Sciences |
| Yubo Tao | Zhejiang University |
| Chaoli Wang | University of Notre Dame |
| Yu-Shuen Wang | National Chiao Tung University |
| Hsiang-Yun Wu | TU Wien |
| Yanhong Wu | HKUST |
| Panpan Xu | Bosch Research |
| Hsu-Chun Yen | National Taiwan University |
| Hongfeng Yu | University of Nebraska-Lincoln |
| Ying Zhao | Central South University |